I was (& am) a learner in Computer Science, so I code. When it comes to visualization, I learn about design and code accordingly to build visualizations and interactive ones. Computer Science is a fast-moving area: this one design idea, in a minute, becomes the graphical thingy on the computer screen. What should I do if I want to sit with that design idea for a little bit longer, analyze the use of it systematically and learn whether it is a good idea?
The starting point
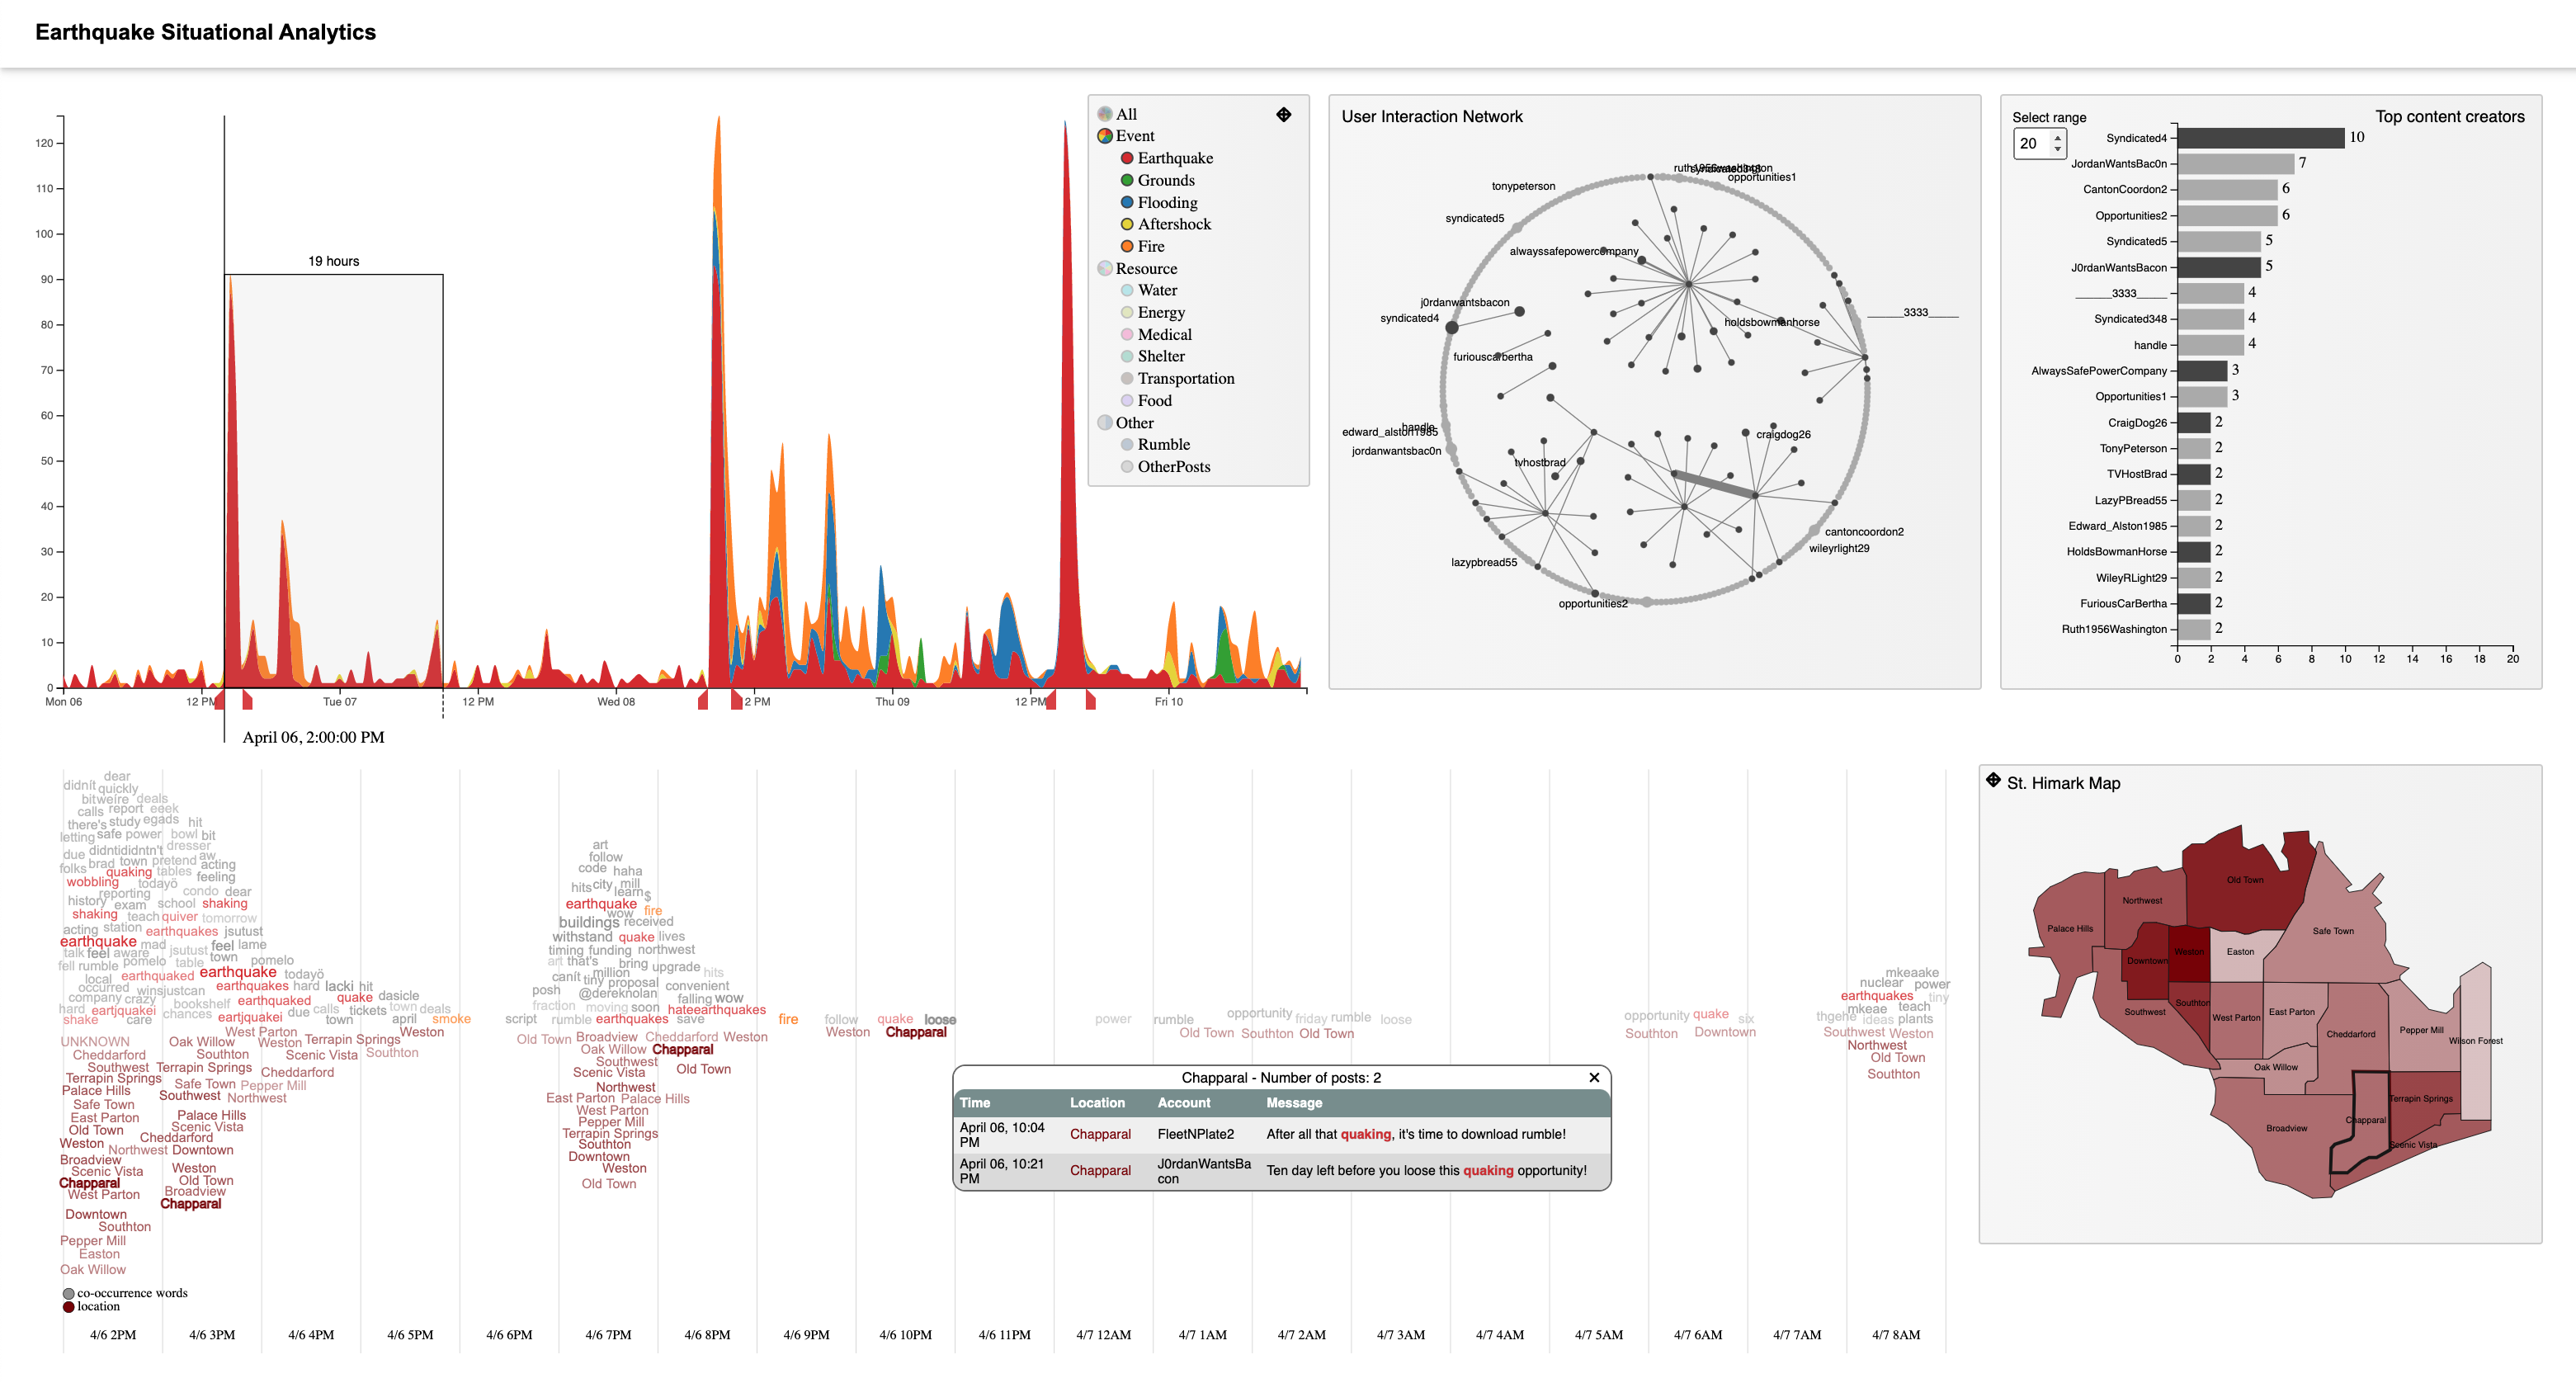
I remember the time when I was working on the VAST challenge during the summer of 2019. The joy of working/coding grew on me. By the end, this whole beautiful interactive dashboard came out as a result. I didn’t win that year. But I love the design and every visual component of it.
I wish I had more time to look at the visualizations and see what insight it can help me discover, or, more conceptually, what design intuition I can rely on and strengthen when delving deep into what I have created. But, new projects came in, and my energy can be devoted only for so long.
GRC 2019
I attended the 2019 Gordon Research Conference (GRC) on Visualization in Science and Education. That was a mesmerizing memory for me. That was the first time I got to present my work in front of other people outside my university; little did I know they were not even from Computer Science, so I needed to communicate effectively to present my work to their audience.
I prepared my presentation super carefully. My work was on WordStream, a visualization tool that helps demonstrate topic evolution overtime. Here is an application of it on News domain:
I am thrilled that the people at the GRC loved my work, including the professors that I got a chance to discuss my work with and the researchers working on interdisciplinary visualization research. I was introduced by my mentor Mike Stieff to the talented people: Kathleen Jeffery, Kevin Wee and Caleb Trujillo. We formed a team to join the competition for the Visionary Grant! We hoped to utilize the WordStream to ease the challenging task of analyzing text input from students, indicating the progression throughout the learning process. We also presented a current shortage of interdisciplinary research between visualization and qualitative research using the co-citation network.
We were awarded the Visionary Grant with the proposal!
Here I am, a year after the award. We worked hard before and during COVID. I was the one responsible for developing the system, I know I need to work well on my part. Listening to the feedback from fellow teammates was great because they are the researchers that eventually would use the system to carry out the analysis.
I got to see how my baby can be meaningful to other people, helping them do their tasks more easily. That’s the best feeling!
– I’d elaborate more on this. This is not just some problem that starts and ends within the lab, but a real challenge that demands a realistic solution. Somehow it’s more practical but requires a more abstract and conceptual perspective and outlook.